 how-to
How to Interpret Peptide HPLC Analysis: A Guide
Table of Contents
- How to Interpret Peptide HPLC Analysis: Reading the Chromatogram
- Common Peaks and What They Mean
- How to Read a Peptide COA Alongside the Chromatogram
- Peptide Impurity Identification on the Trace
- Common Peptide HPLC Artefacts That Mislead You
- Gradient Profiles, Retention Time and Method Notes
- Conclusion
- Frequently Asked Questions
Last Updated: 15 October 2026
How to Interpret Peptide HPLC Analysis: Reading the Chromatogram
Peptide HPLC analysis is the process of separating a peptide sample by high-performance liquid chromatography and reading the resulting trace to judge purity, identity and contaminants. At JGPep+, we supply research materials with a batch-specific Certificate of Analysis for every vial, so reading that trace correctly matters. This guide shows you how.
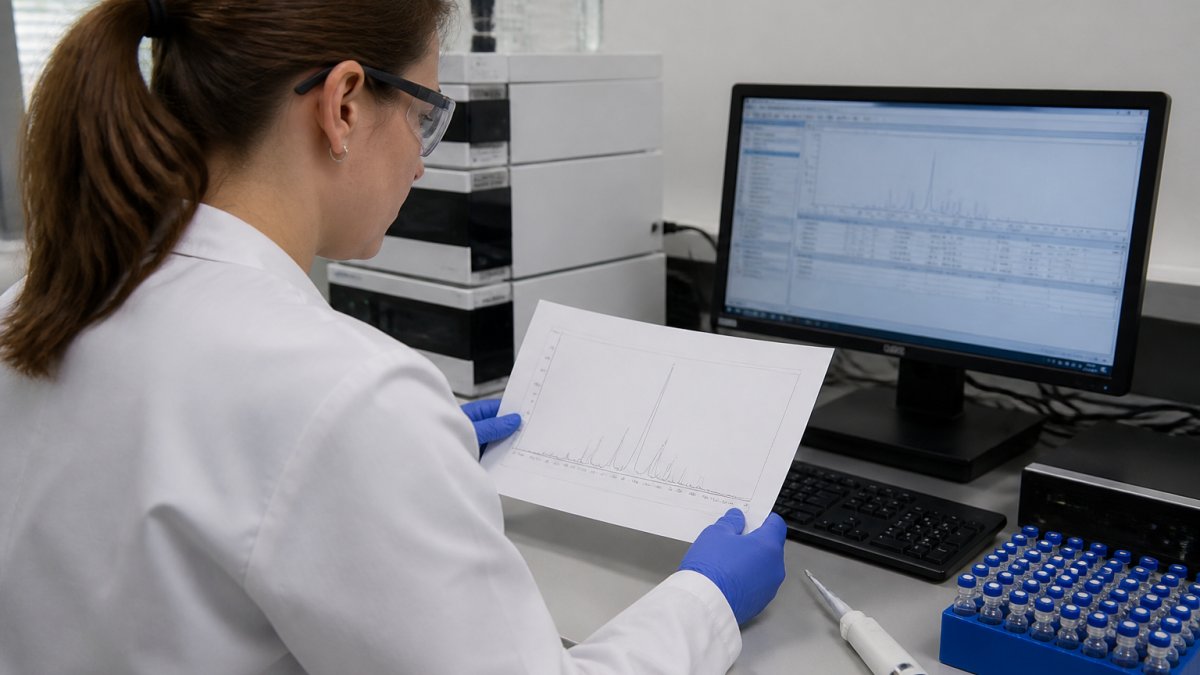
A chromatogram is a graph. The x-axis is time, measured in minutes. The y-axis is detector response, usually absorbance at 214 nanometres for the peptide bond. Each peak is a group of molecules that left the column together. The main peak should be your target peptide. Everything else is something you did not intend to make.
What the Axes and Peaks Tell You
Read the x-axis first. Retention time tells you when a compound eluted. Your target peptide should appear at a consistent time across batches run on the same method. A shift of more than a fraction of a minute suggests a problem with the column, the gradient or the sample.
Then read the y-axis. Peak height and area show how much material eluted. Purity is usually reported as the percentage of total peak area taken by the main peak. A clean single peak does not guarantee identity on its own, which is why the COA pairs the trace with mass confirmation.
Common Peaks and What They Mean
Most traces contain more than one peak, and knowing which is which saves hours of confusion. The position and shape of each peak points to its likely source.
The Main Peptide Peak
The main peptide peak is the tallest, sharpest peak in the trace and represents your intended sequence. A well-behaved main peak is symmetrical, with a smooth rise and fall. Compare its retention time against your method reference and against previous batches of the same product.
Shoulder Peaks and Split Peaks
A shoulder is a bump on the side of the main peak. A split peak is a main peak with a visible dip in the middle. Both usually mean the column is overloaded or the sample solvent is too strong. Try diluting the sample or reducing injection volume before you assume the peptide itself is impure.
How to Read a Peptide COA Alongside the Chromatogram
A Certificate of Analysis is a batch-specific document that reports the measured results for one lot, and it should always be read next to the trace it describes. The COA confirms what the chromatogram shows.
Check these items in order:
- Batch or lot number matching the vial label
- Method reference, so you know the gradient and column used
- Purity percentage, taken from the main peak area
- Mass confirmation, usually by mass spectrometry
- Appearance and storage notes for the material
If the COA shows a purity figure but no trace, ask for the trace. A number alone tells you very little about what else is in the vial. At JGPep+, every product listing links to batch-specific COA documentation, so you can check the record before you commit to an order.
Peptide Impurity Identification on the Trace
Peptide impurity identification is the practice of matching each extra peak to a likely chemical cause. Once you know the usual suspects, the trace becomes readable.
The most common impurities are:
- Deletion sequences, where one amino acid is missing
- Truncation products, where synthesis stopped early
- Oxidised forms, often of methionine or tryptophan residues
- Diastereomers, from racemisation during coupling
Deletion and Truncation Sequences
Deletion and truncation sequences are closely related to your target, so they often elute near the main peak. That is what makes them hard to spot. A small peak sitting just before or after the main peak is a strong candidate.
View the complete research peptide catalogue →
Mass spectrometry settles the question. A deletion sequence will show a mass shift equal to the missing residue. If your COA includes mass data, compare the observed mass against the expected value for the full sequence.
Common Peptide HPLC Artefacts That Mislead You
Common peptide HPLC artefacts are features that look like impurities but are not. Learning to spot them stops you discarding good material.
Watch for these:
- Solvent front peaks near the start of the run, which are not sample-related
- Ghost peaks that appear in blank injections, usually from carryover
- Baseline drift from gradient changes, not from the peptide
- Air bubbles in the detector cell, which cause sharp false spikes
Run a blank injection before your sample. If a peak appears in the blank, it is not your peptide. This single habit solves most false alarms.
Gradient Profiles, Retention Time and Method Notes
Gradient profiles control how your peptide elutes, so the method notes on the COA matter as much as the trace itself. A different gradient produces a different chromatogram from the same sample.
Key method details to record:
- Column type and dimensions
- Mobile phase composition, including ion-pairing agent
- Gradient slope and run time
- Flow rate and detection wavelength
Without these, you cannot compare one batch against another. Two traces run on different gradients are not directly comparable, even if the purity figures look similar.
The United States Pharmacopeia general chapters on chromatography set out widely used system suitability checks, and the MHRA guidance on laboratory data integrity explains why method records must be traceable. For research-grade materials, the Royal Society of Chemistry resources on analytical method validation offer useful background on method notes.
| Trace Feature | Likely Cause | What To Do |
|---|---|---|
| Shoulder on main peak | Column overload | Dilute and re-inject |
| Split main peak | Strong injection solvent | Reduce injection volume |
| Peak near main peak | Deletion sequence | Check mass data |
| Peak in blank run | Carryover or ghost peak | Clean the system |
| Rising baseline | Gradient drift | Correct baseline before integrating |
Conclusion
Reading a peptide trace well takes practice, and the details matter when your research timeline depends on it. JGPep+ supplies research peptides with clear product identification, batch-specific COA documentation and transparent GBP pricing, with tracked UK dispatch and free delivery on orders over £100. Our catalogue is built for in vitro and analytical work, with documentation you can check before you order. View the complete research peptide catalogue and compare batch records for yourself.
Frequently Asked Questions
What is considered an acceptable purity level for research peptides?
For most in vitro and analytical research, a purity of 95% or higher is treated as the working benchmark, and many method development labs look for 98% or above. The figure that matters is the one stated on the batch-specific COA and confirmed by the HPLC trace, not a marketing claim. Always check that the percentage refers to the main peptide peak area at the stated wavelength, and that the method used is described. If the COA gives no method detail, treat the purity figure as unverified.
How do I identify impurities on a peptide HPLC chromatogram?
Peptide impurity identification starts with comparing every peak against the main peptide peak. Impurities usually appear as smaller peaks eluting before or after the main one, representing deletion sequences, truncated fragments or oxidised variants. Calculate each as a percentage of total peak area. Anything above roughly 1% deserves attention, and clusters of small peaks often indicate incomplete synthesis or poor purification. Cross-reference the retention times with the COA to confirm which peaks the supplier has already accounted for.
Why does retention time matter in peptide HPLC analysis?
Retention time tells you when a compound elutes from the column, and it is the primary way you match a peak to a known peptide. If the retention time shifts between runs on the same method, it usually points to column ageing, temperature drift or a gradient problem rather than a different compound. Comparing the retention time on your trace with the value stated on the COA is one of the quickest checks that the batch matches its documentation.
What is the difference between crude and purified peptide HPLC profiles?
A crude peptide profile shows many peaks of similar height, because the synthesis mixture still contains deletion sequences, truncated fragments and other by-products. A purified profile is dominated by one main peak, with impurities reduced to small shoulders or minor peaks. When you interpret peptide HPLC analysis, the ratio between the main peak and everything else is the clearest signal of which stage you are looking at. Purified material should show a single dominant peak with a flat baseline either side.